A coffee shop owner in Austin opens at six in the morning, taps a card, takes an order on a tablet, syncs the day’s inventory at noon and runs payroll on a phone before close. None of those workflows used to live inside merchant services. In 2026 they all do, and the providers that bundle them are taking share at the expense of every provider that still sells card acceptance as a stand-alone line item.
The US merchant services market is on a clear path to keep compounding through the decade. Card acceptance revenue alone is projected to reach $202 billion in payment processing fees by 2030, per Fortune Business Insights. The growth is now driven less by new merchants coming online and more by deeper software attach inside existing ones, and that shift is what is reshaping who wins the front counter.
Square Set the Template the Rest of the Market Is Now Copying
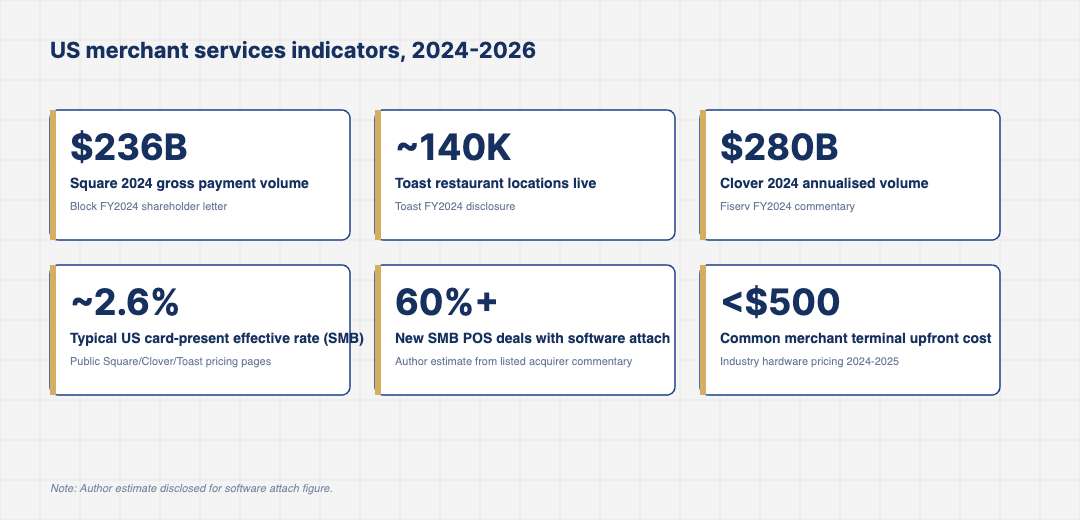
Block reported $236 billion in Square gross payment volume in its FY2024 shareholder letter, with seller-side gross profit rising at a double-digit rate year over year. Square’s template, a flat hardware fee, a simple percentage rate, deep software defaults and instant onboarding, has become the baseline expectation for any new merchant in the US.
That template is now widely copied, and the implication is that hardware and acceptance are no longer differentiators. The differentiator is what sits above them: the speed of menu changes at a restaurant, the depth of inventory sync at a retailer, the quality of payroll integration at a service business. Square continues to expand into each of these adjacent surfaces, and the underlying acquiring economics increasingly feel like a delivery vehicle for a broader operating-system product.
Cash App for Business and Tap to Pay on iPhone have made acceptance even more frictionless at the very bottom of the market, where new sellers can start taking cards without buying any hardware at all. That development has expanded the merchant pool without meaningfully changing Square’s economics on it; the addressable surface keeps widening, and incumbents that still require contracts and minimum monthly volumes are increasingly invisible to this segment.
Toast Showed What Vertical Acceptance Looks Like at Scale
Toast reported approximately 140,000 active restaurant locations on its platform in its FY2024 disclosure, with platform-attach for online ordering, payroll and inventory continuing to climb. The company’s primary product is a vertical operating system for restaurants, with merchant services as the underlying monetisation layer. Hardware sales are essentially break-even; the company makes its money on processing and on the long-tail software modules sold inside the platform.
The Toast model demonstrates that vertical-focused acceptance can sustain materially higher take rates than generic acquirers, because the merchant is paying for the operating system, not the rails. That insight has been the foundation of nearly every successful US vertical PSP launched in the past five years, and it is the playbook that competitors in fitness, beauty, home services and healthcare are now running.
What is harder to copy than the product is the merchant-success organisation. Toast invests heavily in onboarding consultants who help restaurants migrate their menus, train staff and set up online ordering. That field-level work is expensive but it is also what keeps churn low. Vertical PSPs that try to scale without it tend to see early growth followed by sharp churn once the second-year invoice lands and the merchant has to re-evaluate the relationship.
Clover and the Listed Acquirers Are Re-Pricing the Mid-Market
Fiserv’s Clover platform reported approximately $280 billion in annualised payment volume in Fiserv’s FY2024 commentary, with mid-market merchant share growing. Clover, along with Worldpay and Global Payments, has spent the past two years trying to close the software gap with Square and Toast by acquiring vertical ISVs, expanding marketplace apps and adding embedded financing modules.
Pricing is where the pressure now sits. Effective rates at the SMB end of merchant services have drifted toward 2.5% to 2.7% on card-present transactions, and the listed acquirers are absorbing more network rule changes themselves rather than passing them through. That decision protects merchant relationships in the short term but compresses operating margin, which is starting to show up in earnings commentary, particularly in the merchant-acceptance segments of the larger payments holding companies.
Embedded financing has become a notable revenue line for several of the larger merchant services brands. Clover Capital, Square Loans and Toast Capital all offer working-capital advances repaid out of card receivables, and the take rates on those products contribute meaningful incremental revenue per merchant without changing the underlying acceptance pricing on the card line. Underwriting risk is the constraint, and the providers that compound here are those with the best transaction-history models on their own merchant bases.
Hardware Refresh Is the Quiet Story
The contactless reader on the counter is no longer the story. The story is the Android-based merchant terminal that runs the POS, the loyalty program, the inventory check and the payroll lookup in the same shell. Most major US merchant services providers now ship some variant of this device, with upfront costs in the $300 to $500 range and the heavy economics coming from the software and acceptance on top.
The hardware refresh cycle matters because it locks the merchant into the provider’s ecosystem for years. A merchant who replaces a Clover terminal with another Clover terminal is making a multi-year commitment to Clover’s pricing, software roadmap and processor relationship. Providers that get this refresh cycle right keep growing volume even when their net new merchant count is flat, which is why the listed acquirers are investing in hardware design and supply-chain capacity even as they reduce headcount in other areas.
Hardware also matters for downtime. A merchant whose terminal goes offline at peak lunchtime loses meaningful revenue in minutes, which is why the major providers now ship redundancy options, offline mode and ruggedised devices for higher-traffic environments. The reliability story is rarely a headline feature but it shows up in renewals and in word-of-mouth recommendations among small business owners, which remains one of the most important acquisition channels for SMB merchant services in the US.
Where the 2026 Merchant Services Spend Is Concentrating
Three buckets absorb most of the new merchant services investment at major US providers. The first is software attach, where each new SMB merchant is sold one or more recurring software modules at signup, and the attach rate is climbing toward two-thirds of new deals at the leading providers. The second is omnichannel orchestration, which lets a merchant accept, refund and reconcile across in-store, online, marketplace and in-app channels through a single account. The third is embedded financing and capital products, where the provider underwrites a working capital advance against future receivables.
None of those investments produce a marketing moment. They show up in retained merchants, higher average revenue per account and a slow tightening of the gap between gross processing volume and net merchant revenue. The providers that compound those gains across the next 24 months are the ones that will hold their take rates as competition intensifies, and they are also the ones best positioned for the next round of acceptance changes driven by tokenisation and faster funding.
For operators and investors tracking US merchant services through 2026, the practical signal is to watch the software attach rate on new merchant additions, the average revenue per merchant trend and the share of processing volume coming through vertical platforms, because those three together will explain the gap between the providers that compound and the ones that drift sideways.
The strategic picture coming into 2026 is one where the merchant relationship has clearly migrated from the acquirer up to the software platform, and the providers that lean into that reality with serious developer programs, vertical specialisation and integrated capital products are the ones that compound the relationship across multiple revenue lines rather than competing only on the card-acceptance rate.